Spotify Playlist Feature Analysis
Overview
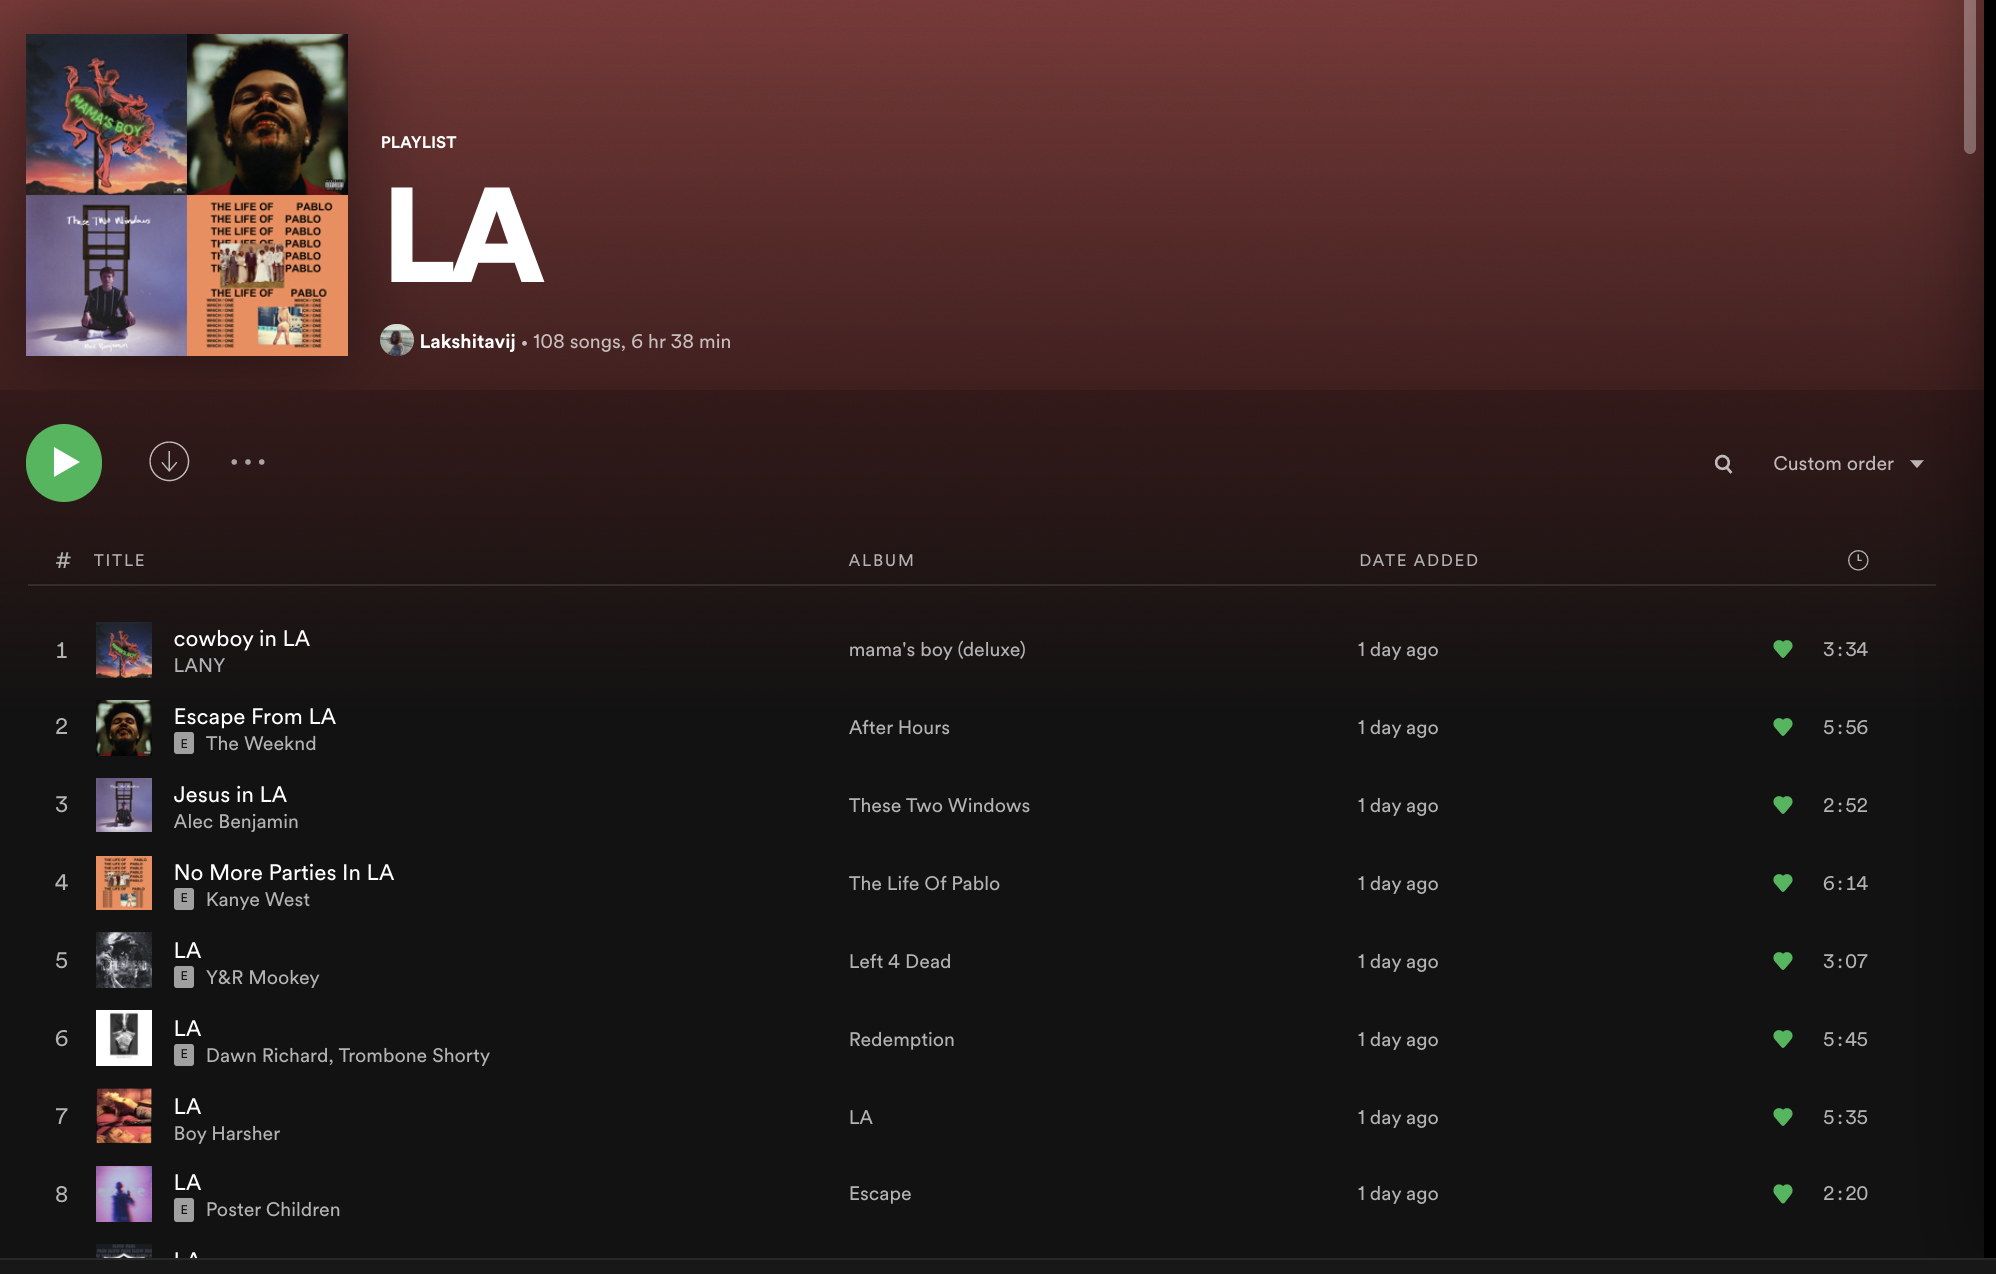
I love Los Angeles. Even though I was only there for 3 years due to Covid, for me it will always hold a special place in my heart, being the place that taught me agency, and gave me so much love. So I decided to see if songs about Los Angeles echo my sentiment about the city. I developed a Python script that uses the Spotify API to download information about songs from any specified playlist. Here, I made a playlist of 100 songs which have Los Angeles, or LA in the name. It then organizes the data into a pandas DataFrame, displaying details such as song name, album, artist, popularity, and various audio features. Finally, it creates a scatter plot using seaborn to visualize the danceability, energy, and valence of a subset of songs from the playlist.
LA playlist
Results
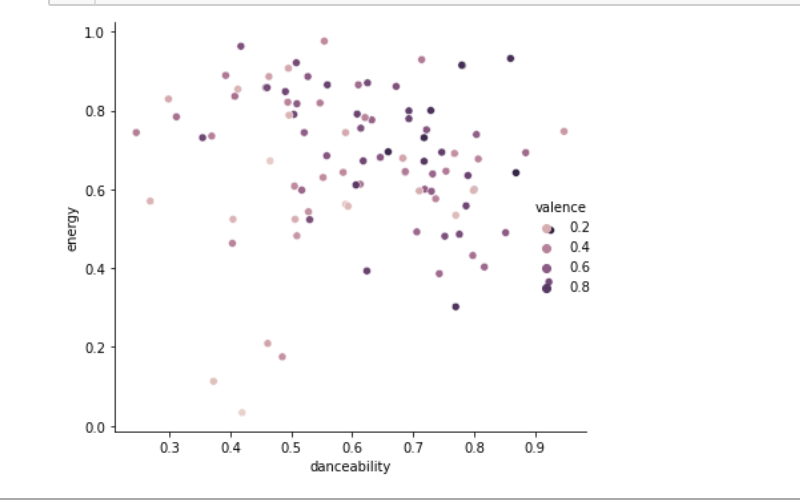
This shows how the playlist fares in terms of valence, or the musical positiveness conveyed, energy, and danceability, on a scale of 0.0 to 1.0
As can be seen from the graph, all songs about LA fare high on the list, making it being represented high energy, highly positive and vibrant city, even musically